HomeBlogB2B e-procurement platformB2C online marketplaceBest PracticeC2C platformsMarketplace KPIs: The Essential Guide for 2026
Marketplace KPIs: The Essential Guide for 2026
Like any business, running a marketplace requires close monitoring of key performance indicators (KPIs) to […]
Marketplace KPIs: The Essential Guide for 2026
- Julien Bruitte
- Estimated reading time: 10 minutes

Like any business, running a marketplace requires close monitoring of key performance indicators (KPIs) to evaluate success and guide decision-making.
Many of these KPIs are shared with traditional e-commerce. But some take on a specific dimension in a marketplace context, particularly those that concern the three-way relationship between the operator, sellers and buyers. A marketplace cannot be managed like a single-vendor e-commerce site: you need to measure the health of both sides of the platform, and the quality of the intermediation in between.
This guide covers the 15 essential metrics for managing a marketplace in 2026, whether it operates in B2B, B2C or C2C.
The various KPIs discussed in the article:
1. Transactional KPIs
These are the fundamentals of marketplace performance. They measure the volume of activity and the commercial momentum of your platform.
⮕ GMV (Gross Merchandise Volume)
GMV represents the total value of transactions completed on your marketplace over a given period. It is the headline metric for any marketplace, the one that investors, partners and senior leadership focus on.
GMV should not be confused with the operator’s revenue. On a marketplace, your income comes primarily from commissions collected on sales. GMV measures the total value exchanged; commissions measure what you capture from it. For a detailed breakdown, see our dedicated article on GMV in a multi-vendor marketplace.
How to use it: track GMV in absolute terms, month-on-month growth and year-on-year growth. Segment it by product category, by seller and by buyer segment to identify growth drivers and weak spots.
⮕ Take rate (effective commission rate)
The take rate is the percentage of GMV that the operator captures as revenue (commissions, subscriptions, service fees). It is the direct link between transaction volume and marketplace profitability.
Formula: Take rate = Operator revenue / GMV x 100
A take rate that is too low indicates insufficient monetisation. A take rate that is too high may discourage seller adoption. The right balance depends on your sector and the value you deliver. Our article on marketplace take rate provides benchmarks by industry.
⮕ Average Order Value (AOV)
AOV measures the average amount spent per order. It is calculated by dividing GMV by the total number of orders.
One of the key advantages of a multi-vendor marketplace is its ability to bring together many sellers on a single platform. As the product range expands, AOV tends to increase: buyers find everything in one place and consolidate their purchases.
How to use it: cross-reference AOV with your seller recruitment activity. Each new seller onboarded should have a positive impact on AOV or on an underrepresented category.
⮕ Number of transactions
The raw number of orders placed is a concrete usage indicator. GMV growth combined with a declining number of transactions signals concentration on a few large orders, which is a risk. Ideally, both metrics should grow together.
2. Buyer KPIs
These metrics measure your marketplace’s performance from the buyer’s perspective.
⮕ Conversion rate
The conversion rate measures the percentage of visitors who complete a purchase. It is a universal metric, but in a marketplace it reflects several dimensions at once: offer quality (do buyers find what they are looking for?), UX design and checkout flow efficiency.
How to use it: if the conversion rate is low despite high traffic, the problem lies with the offer or the user experience, not with acquisition. Analyse conversion rate by category, by traffic source and by device (desktop vs mobile) to pinpoint friction points.
⮕ Customer Acquisition Cost (CAC)
CAC represents the total cost to acquire a new customer: marketing spend, advertising, sales team, promotions. It is a critical indicator for your marketplace’s economic viability.
The golden rule: CAC must always remain below CLV (Customer Lifetime Value), the total revenue a customer generates throughout their relationship with your platform. If your CAC exceeds your CLV, you are losing money on every customer acquired.
⮕ Retention rate and repeat purchase rate
Buyer loyalty is the hallmark of a marketplace that works. The retention rate measures the percentage of customers who return to buy over a given period (30, 60, 90 days). The repeat purchase rate refines this by counting customers who actually place a new order.
Why it matters: acquiring a new customer costs 5 to 7 times more than retaining an existing one. A marketplace with a high repeat purchase rate has a far healthier business model.
⮕ Net Promoter Score (NPS)
NPS measures the likelihood that your buyers will recommend your marketplace. It is calculated by asking one simple question: “On a scale of 0 to 10, how likely are you to recommend our platform?”
Respondents fall into three categories: promoters (9-10), passives (7-8) and detractors (0-6). NPS = % promoters – % detractors.
How to use it: measure buyer NPS AND seller NPS separately. A high buyer NPS but low seller NPS signals an imbalance in the value you create for both sides of your platform.
Ensure nothing is overlooked in your project specifications
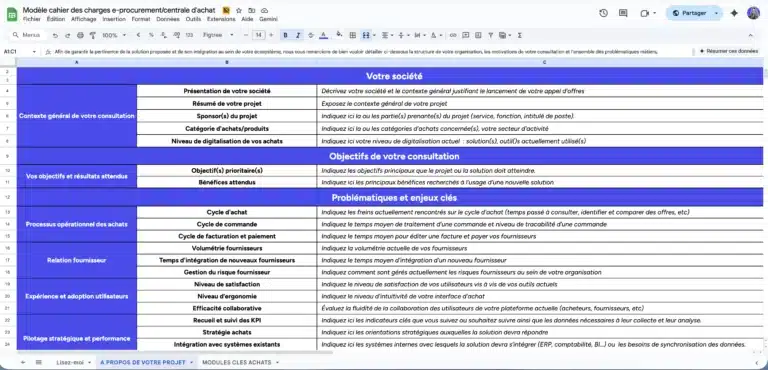
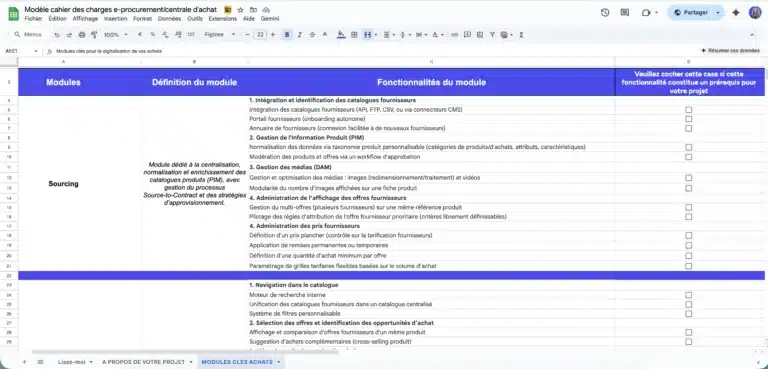
A ready-to-use template to quickly frame your e-procurement or purchasing group project, compare market solutions, and secure your vendor consultation process.
Comprehensive model used in B2C, B2B or C2C projects and ready to adapt.
3. Seller KPIs
Sellers are the engine of your marketplace. Without active, high-performing sellers, there is no supply, no transactions and no revenue.
⮕ Seller activation rate
The activation rate measures the percentage of registered sellers who have actually published at least one product and completed at least one sale. It is the metric that reveals the quality of your onboarding process.
A low activation rate (below 50%) signals a problem in the onboarding journey: registration form too complex, catalogue import too burdensome, lack of support. The time to first sale (number of days between registration and first completed order) complements this metric.
⮕ Seller churn rate
The churn rate measures the percentage of sellers who leave your marketplace over a given period. High churn erodes your supply and your growth capacity.
It is important to distinguish two types of churn:
- Involuntary churn: the seller leaves by choice (dissatisfaction, too few orders, workload too heavy).
- Managed churn: the operator deactivates a seller who breaches terms or degrades platform quality.
Involuntary churn is a warning signal. Managed churn is a sign of good governance.
⮕ Seller performance metrics
Each seller on your marketplace should be individually assessed across several dimensions:
- Average order processing time: from order receipt to dispatch.
- Order acceptance rate: percentage of orders confirmed vs refused or cancelled.
- Average response time: time to respond to buyer messages and quote requests.
- Return and refund rate: percentage of products returned or refunded. An abnormally high rate for a specific seller indicates a quality or product conformity issue.
- Average buyer rating: if you collect reviews, the overall seller rating is a satisfaction barometer.
These metrics, aggregated into a seller score, allow you to identify sellers to reward, those to support and those to sanction. See our guide on handling disputes in marketplaces for how to link seller performance to conflict resolution.
4. Operator KPIs
These metrics measure the operator’s performance as the platform manager.
⮕ Overall return and refund rate
This KPI measures the percentage of orders that result in a return or refund across the entire marketplace. A high rate signals systemic problems: misleading product descriptions, delivery issues, inconsistent seller quality.
How to use it: segment the return rate by seller to identify the main contributors. Set up alert thresholds and automatic corrective actions. Our article on creating product data sheets for your marketplace covers best practices for reducing returns caused by insufficient descriptions.
⮕ Customer service response time
Support response time is an operational efficiency indicator. In a marketplace, it is influenced as much by operator responsiveness as by seller responsiveness. Track this KPI globally and by seller.
Benchmark: the most performant marketplaces target a first response time under 4 hours in B2C and under 24 hours in B2B.
⮕ Traffic and acquisition sources
Analysing traffic and its sources (SEO, PPC, email, social media, direct access) is essential to understand where your buyers come from and which channels are most cost-effective.
In 2026, a new metric is emerging: the share of traffic coming from generative AI interfaces (ChatGPT, Google AI Overview, Perplexity). These new discovery channels are increasingly impacting marketplace traffic and require specific optimisation of your product data to ensure visibility to AI agents.
⮕ Marketplace liquidity
Liquidity measures the probability that a search or visit results in a completed transaction. Concretely: when a buyer searches for a product, do they find it? When they find it, do they order? And when they order, does the seller confirm?
Simplified formula: Liquidity = Number of successful transactions / Number of searches or visits
This is a powerful diagnostic metric for supply/demand fit. Low liquidity indicates either insufficient supply (not enough sellers or products), insufficient demand (not enough buyers), or a matching problem (the supply exists but the buyer cannot find it). Our article on product-market fit for marketplaces explores this dynamic.
5. Emerging KPIs for 2026
The marketplace landscape is evolving. New metrics are becoming relevant for managing a platform in 2026.
⮕ Catalogue Quality Score
With the rise of agentic commerce and AI agents that search for products on behalf of buyers, catalogue data quality is becoming a direct competitive factor. The Catalogue Quality Score measures the percentage of product listings that meet completeness standards: normalised title, structured description, technical attributes filled in, compliant images, up-to-date pricing, synchronised stock.
Marketplaces with “AI-ready” catalogues will rank better with AI agents and generative search engines. See our article on catalogue visibility and product referencing for B2B to understand what is at stake.
⮕ AI adoption rate (if applicable)
If your marketplace integrates an AI buyer assistant (such as Origami Copilot), track its adoption rate: percentage of buyers who use the assistant, number of conversational searches, conversion rate via AI vs standard journey, impact on AOV.
Early deployments show significant results: up to 90% reduction in product search time and a 25% increase in average basket size for buyers who use the AI assistant.
⮕ GEO Score (Generative Engine Optimisation)
The GEO Score measures your marketplace’s visibility in generative AI responses (ChatGPT, Google AI Overview, Perplexity). In 2026, a growing share of product discovery occurs through these conversational interfaces. Marketplaces that are not “readable” by LLMs are gradually losing visibility.
This KPI is still emerging, but the most advanced operators are beginning to track it alongside their traditional SEO rankings.
⮕ Supplier compliance rate
With increasing regulatory requirements around KYC/KYB documentation, the supplier compliance rate is becoming an essential operational KPI. It measures the percentage of sellers whose documents are current and valid.
6. How to use these KPIs in practice
⮕ Build a layered dashboard
Do not track all KPIs in the same way. Structure your dashboard in three tiers:
- Strategic KPIs (monthly review): GMV, take rate, number of active sellers, NPS. These are the indicators that senior leadership monitors.
- Operational KPIs (weekly review): conversion rate, seller activation rate, order processing time, return rate. These are the indicators the operations team manages daily.
- Alert KPIs (real-time monitoring): seller churn, dispute rate, support response time, document compliance. These are the indicators that trigger immediate corrective action.
⮕ Segment to understand
A global KPI often masks very different realities. Systematically segment your metrics:
- By seller type (large vs small, new vs established, by category).
- By buyer segment (enterprise vs SME, new vs returning, by geography).
- By product category (some categories may drive GMV up while having a problematic return rate).
⮕ Correlate your metrics
KPIs taken in isolation tell an incomplete story. Correlations reveal the real dynamics:
- Rising GMV + rising seller churn = fragile growth, concentrated on a few sellers.
- Declining conversion + rising traffic = offer or UX problem.
- High buyer NPS + low seller NPS = imbalanced model, risk of seller defection in the medium term.
- Rising AOV + declining transaction count = purchase concentration, losing the long tail.
For a complementary view focused on B2B procurement, see our article on procurement KPIs: 10 essential metrics.
Conclusion.
KPI-driven management is the foundation of a high-performing marketplace. Whether you are building your B2B marketplace, digitising your group purchasing organisation or deploying an e-procurement solution, our experts can help you define the most relevant indicators for your model and set up the right tracking tools.
Let's talk about your project.
Let’s discuss it. our expertise extends beyond the tool as we help you structure your project with the right methodology to guarantee its success.

FAQ
At launch, focus on three metrics: the number of active sellers (do you have enough supply?), the seller activation rate (are your sellers actually publishing?) and the number of transactions (are supply and demand meeting?). GMV and take rate become relevant once the transactional momentum is established.
It depends on the metric. Strategic KPIs (GMV, NPS, take rate) deserve a monthly review. Operational KPIs (conversion, activation, processing times) should be tracked weekly. Alert KPIs (churn, disputes, compliance) need to be monitored in real time or daily.
A low conversion rate can have several causes: insufficient supply (not enough sellers or products), incomplete product listings, overly complex checkout flow, lack of trust signals (no reviews, no guarantees). Diagnose the root cause before acting. Our marketplace strategy and best practices guide can help you identify the levers.
Seller churn is often linked to a lack of orders (the seller is not generating enough sales), a lack of support (the seller does not know how to use the platform) or dissatisfaction with terms (commission too high, processes too heavy). Set up proactive monitoring of inactive sellers, offer training and gather regular feedback.
Benchmarks vary considerably by model (B2B, B2C, C2C) and sector. As a rough guide, average conversion rates sit between 1% and 3% in B2C and between 5% and 15% in B2B (as traffic is more qualified). Average take rates range from 5% (industrial) to 25% (services). The average NPS for high-performing marketplaces is above 40.