HomeBlogB2B e-procurement platformBusiness modelB2B Marketplace ROI: How to calculate your return?
B2B Marketplace ROI: How to calculate your return?
“How much does it cost and how much does it bring in?” That is the […]
B2B Marketplace ROI: How to calculate your return?
- Arnaud
- Estimated reading time: 14 minutes
“How much does it cost and how much does it bring in?”
That is the first question any CEO, CFO or investment committee asks when presented with a B2B marketplace project. And it is often the question project sponsors answer worst. Either they put forward a fantasy ROI based on hypothetical GMV, or they drown their audience in 5-year projections nobody believes.
The ROI of a B2B marketplace can be calculated. Not by guesswork, but with a structured method that accounts for total cost of ownership (TCO), direct revenue (commissions, subscriptions), indirect gains (processing cost reduction, supplier rationalisation) and payback period.
According to Gartner, companies that deliver a frictionless, unified digital commerce experience see revenue growth of 20% or more. And Forrester estimates that over half of large B2B transactions (USD 1 million or greater) already flow through digital self-service channels, including marketplaces. The potential is real, provided you know how to quantify it.
This article gives you the method, the formulas and the benchmarks to build a credible business case.
1. The marketplace ROI formula (and why it is misleading alone)
The basic formula, ROI is calculated simply:
ROI = (Total gains – Total cost) / Total cost x 100
A marketplace project with an EUR 80,000 TCO over 3 years that generates EUR 400,000 in cumulative revenue and EUR 50,000 in operational savings shows a 462% ROI ((450,000 – 80,000) / 80,000). On paper, that looks outstanding.
Why this formula alone falls short
The trap with aggregate ROI is that it squashes everything into a single number. It says nothing about the payback timeline (the 462% is achieved over 3 years, not 3 months), the temporal distribution of gains (revenue is low in year 1, strong in year 3), or the reliability of the assumptions (is the projected GMV realistic?).
A credible business case breaks ROI into its components: TCO on one side, revenue streams and gains on the other, with a realistic timeline. That is what we are going to build.
2. Calculating total cost of ownership (TCO)
TCO captures every cost associated with your marketplace over a defined period (typically 3 years). Organisations that focus only on the initial purchase price end up spending 40-60% more over the project lifetime compared to those that calculate TCO (SpecLens, 2026).
Ensure nothing is overlooked in your project specifications
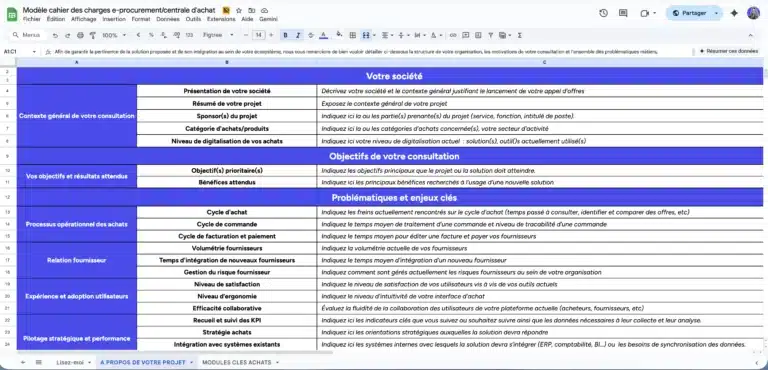
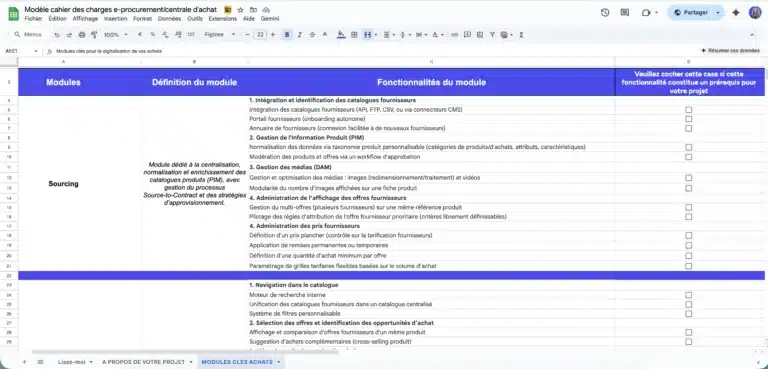
A ready-to-use template to quickly frame your e-procurement or purchasing group project, compare market solutions, and secure your vendor consultation process.
Comprehensive model used in B2C, B2B or C2C projects and ready to adapt.
Cost categories to include:
Acquisition costs (year 0):
- SaaS licence or subscription (initial setup fee if applicable).
- Front-end integration (design, front-office development).
- SI connectors (ERP, PIM, PSP, CRM).
- Scoping and advisory (launch support).
- Change management (training, internal communications).
Recurring costs (annual):
- SaaS subscription (monthly or annual).
- Maintenance and evolutions (if custom development).
- Hosting and infrastructure (if on-premise).
- Dedicated operations team (seller CSM, support, catalogue moderation).
- Marketing and acquisition (SEO, PPC, content marketing).
- PSP fees (payment processing commissions).
Hidden costs (frequently overlooked):
- Internal time (project manager, leadership, approvals).
- Ongoing seller and team training.
- Post-launch feature enhancements.
- Migration costs if switching platforms.
For a detailed comparison of technology approaches, see our marketplace software comparison.
Sample 3-year TCO (B2B marketplace, SaaS):
| Cost category | Year 1 | Year 2 | Year 3 | 3-year total |
|---|---|---|---|---|
| SaaS subscription | EUR 18,000 | EUR 18,000 | EUR 18,000 | EUR 54,000 |
| Front-end integration | EUR 25,000 | - | - | EUR 25,000 |
| SI connectors (ERP, PSP) | EUR 15,000 | EUR 5,000 | EUR 5,000 | EUR 25,000 |
| Scoping and advisory | EUR 10,000 | - | - | EUR 10,000 |
| Operations team (0.5 FTE) | EUR 25,000 | EUR 25,000 | EUR 25,000 | EUR 75,000 |
| Marketing and acquisition | EUR 15,000 | EUR 20,000 | EUR 25,000 | EUR 60,000 |
| PSP fees (~1.5% of GMV) | EUR 3,000 | EUR 9,000 | EUR 18,000 | EUR 30,000 |
| Total | EUR 111,000 | EUR 77,000 | EUR 91,000 | EUR 279,000 |
These figures are indicative. Your TCO depends on the solution chosen, the complexity of your integrations and the size of your team. The SaaS, on-premise, and open-source comparison will help you determine the right approach for your needs.
3. Identifying direct revenue
Direct revenue is the cash flow the marketplace generates for the operator.
Sales commission (take rate)
The primary revenue source for most marketplaces. The operator takes a percentage of each transaction. Take rates range from 5% (industrial sector, thin margins) to 25% (services, high value-add).
Formula: Commission revenue = GMV x Take rate
A EUR 200,000 GMV in year 1 at a 10% take rate generates EUR 20,000 in commission revenue. A EUR 1,200,000 GMV in year 3 at the same rate generates EUR 120,000. See our article on marketplace commissions for sector benchmarks, and our take rate guide for strategic guidance.
Seller subscriptions
If you charge a monthly subscription to sellers (in addition to or instead of commission), this stream is predictable and recurring.
Formula: Subscription revenue = Number of active sellers x Monthly fee x 12
20 sellers at EUR 99/month = EUR 23,760/year. 50 sellers at EUR 149/month = EUR 89,400/year.
Complementary services
Paid product boosting, logistics services, invoicing, on-platform advertising. Marginal at launch but potentially significant at scale.
GMV: the key variable (and the hardest to project)
GMV is the variable that swings your entire ROI calculation. Overshoot it in year 1 and the business case looks great but crumbles on contact with reality. Undershoot it and the project never gets funded.
The best approach: build GMV bottom-up, not top-down.
- How many sellers do you plan to onboard in year 1? (Be realistic: 10 to 20 active sellers is a solid B2B launch target.)
- What is the average order value in your sector?
- How many orders per seller per month?
Formula: GMV = Active sellers x Orders/month/seller x Average order value x 12
15 sellers x 10 orders/month x EUR 1,200 x 12 = EUR 2,160,000 annual GMV.
For more, see our article on GMV in multi-vendor marketplaces.
4. Quantifying indirect gains
Indirect gains do not flow through the marketplace’s cash register, but they reduce costs or increase value for the organisation. In B2B, they are often worth more than direct revenue, especially for internal marketplaces and group purchasing organisations.
Order processing cost reduction
A manually processed order (email, phone, paper purchase order) costs between EUR 50 and EUR 150 in full processing cost (data entry, validation, tracking, invoicing). On a marketplace, that cost drops to a few euros.
Formula: Processing gain = (Manual order cost – Marketplace order cost) x Annual order volume
If you process 5,000 orders per year and the cost drops from EUR 80 to EUR 5 per order, the gain is EUR 375,000/year.
Consolidation and negotiating power
By centralising purchases from multiple entities on a marketplace, consolidated volume enables renegotiation with suppliers. A 3-8% gain on purchase prices is realistic within the first 12 to 18 months. See our article on indirect procurement as a rationalisation lever.
Maverick buying reduction
Off-process purchases (non-approved suppliers, no validation workflow) typically account for 10-30% of spend in unequipped organisations. The marketplace channels these towards approved suppliers at negotiated terms.
5. Building the business case: the 5-step method
| Step | Action to perform | Advice & specifics |
|---|---|---|
| Step 1: Document the 3-year TCO | List every cost line item, year by year. Do not smooth: costs are front-loaded in year 1 (setup, integration) then stabilise in years 2 and 3. | Your marketplace requirements document will help you precisely structure technical cost items. |
| Step 2: Project GMV bottom-up | Build 3 scenarios for Gross Merchandise Value: conservative, realistic, optimistic. | The conservative scenario is what you present to your CFO. The realistic one is used internally. The optimistic one stays in the drawer. |
| Step 3: Calculate direct revenue per scenario | Apply your take rate and subscriptions to the GMV of each scenario defined in the previous step. | Do this strictly year by year. |
| Step 4: Quantify indirect gains | Identify the 2 or 3 most significant indirect gains for your specific context and assign values to them. | Do not try to quantify everything: 2 well-documented and credible gains are better than 10 approximate ones. |
| Step 5: Assemble and stress-test | Compile everything in a spreadsheet: TCO, revenue and gains per year. Calculate cumulative ROI and payback period for each scenario. | Stress-test: what happens if GMV is 30% below the conservative scenario? If take rate drops by 2 points? If launch is delayed by 3 months? The business case must withstand these shocks. |
6. Payback period: when the project turns profitable
ROI is a ratio. Payback period is a timeline: the number of months (or years) for cumulative gains to exceed cumulative investment. Your CFO will look at this first, because it answers one simple question: “When do we get our money back?”
Payback period benchmarks
For a B2B marketplace on SaaS:
- Favourable scenario (marketplace added to an existing customer base, pre-identified sellers, organic traffic already in place): 6 to 12 months.
- Standard scenario (launch from scratch with seller recruitment and buyer acquisition): 12 to 24 months.
- Challenging scenario (competitive market, hard-to-recruit sellers, low brand awareness): 24 to 36 months.
The accelerator: the asset-light model
The marketplace model has a structural advantage over traditional e-commerce: no inventory, no warehouse, no logistics to finance. Cash goes into technology, marketing and operations, not working capital. This asset-light effect shortens the payback period compared to a stock-holding e-commerce project.
7. ROI calculation traps
| Trap | Common mistake | Best practice |
|---|---|---|
| Trap 1: Overestimating year 1 GMV | The most common mistake. Marketplace GMV follows a J-curve: low at launch (few sellers, few buyers, network effects still absent), then accelerating once critical mass is reached. | Budget for very modest GMV in the first 6 months, before modelling post–critical mass acceleration. |
| Trap 2: Forgetting people costs | The SaaS licence is only a fraction of TCO. The real cost is people: project manager time, seller CSMs, buyer support, marketing teams. | Do not underestimate these line items — they are the real engine of a marketplace. |
| Trap 3: Ignoring indirect gains in B2B | Indirect gains are often missing from the business case, even though they represent the majority of value in B2B. | Example: an internal marketplace reducing order processing costs by 75% generates savings that far exceed commission revenue. |
| Trap 4: Comparing marketplace ROI to e-commerce ROI | These models are not comparable on the same basis. Marketplaces have unique operational costs (seller management, moderation, tri-party support). | Compare like for like: highlight structural advantages such as no inventory, expanded catalogue, and take rate model. |
| Trap 5: Presenting a single scenario | A business case with only one scenario is not credible. CFOs know projections are uncertain. | Always present 3 scenarios (conservative, realistic, optimistic). What matters is whether the project remains profitable in the worst case. |
Conclusion
B2B marketplace ROI is as much about preparation as calculation. Whether you are scoping a B2B marketplace build, digitising your group purchasing organisation or deploying an e-procurement platform, our experts can help you build a solid, realistic business case.
Let's talk about your project.
Let’s discuss it. our expertise extends beyond the tool as we help you structure your project with the right methodology to guarantee its success.

ROI depends too heavily on context (sector, scale, model) for a universal figure. What is measurable: well-executed B2B marketplace projects on SaaS reach their payback period in 12 to 24 months under standard conditions. Three-year ROI ranges from 150% to 500%+ depending on GMV achieved and indirect gains captured.
Yes, especially in B2B. For a group purchasing organisation or an internal marketplace, indirect gains (processing cost reduction, consolidation, supplier compliance) often represent more value than commission revenue. Only include gains you can document with verifiable numbers.
Build bottom-up: number of active sellers x orders per seller per month x average order value x 12. Never start from total addressable market (top-down) and derive your share. In B2B, 10 to 20 active sellers at launch with 5 to 15 orders per month each is a realistic target. See our marketplace KPIs guide for benchmarks.
Take rate depends on your sector and value-add. In industrial B2B, 5-10% is the norm. In B2B services, 15-25%. In B2C, 10-20%. Use a conservative take rate in your base scenario. Our article on marketplace commissions provides detailed benchmarks.
No. A public marketplace generates direct revenue (commissions, subscriptions). An internal marketplace generates primarily indirect gains (processing cost reduction, consolidation, compliance). The ROI calculation differs: for an internal marketplace, compare the TCO to the cost of the manual process it replaces, not to a revenue figure.
Present 3 scenarios, not one. Show the payback period for the conservative scenario (that is the only one the CFO cares about). Quantify 2 verifiable indirect gains. And above all, show the cost of inaction: how much do off-process purchases, manual orders and non-digitalisation cost today? See our article on why procurement digitisation reduces TCO for supporting data.